|
|
You are here: Foswiki>Support Web>SupportQuestions>Question652 (27 Nov 2011, GeorgeClark)Edit Attach
This question about Installation of Foswiki: More info required
Help Debugging Performance Issues
Hi. We are really struggling with performance issues since moving from TWiki (4.0.5) to Foswiki (1.0.9). We have upgraded our server hardware (4 x 3.0Ghz running RH3, 6Gb memory) and we think we have tried all the obvious suggestions (running fastcgi, compressing javascript/css). We very willing to do the leg work to debug the performance issues we are having, but need some advice where to start. At the moment, the server is not at all loaded, and a view of an empty page is taking around 2.5 seconds. I have attached below a snapshot from firebug, and the time is taken during the GET of the topic text. How do we go about debugging exactly what the server is taking 2.5 seconds to do? Any advice is appreciated - at the moment, we feel that moving from TWiki to Foswiki has been a step backwards. We have a lot of confidence in the foswiki team, so are sure there must be some local configuration we are missing, but we don't know how to isolate it. Your advice is appreciated, Steve.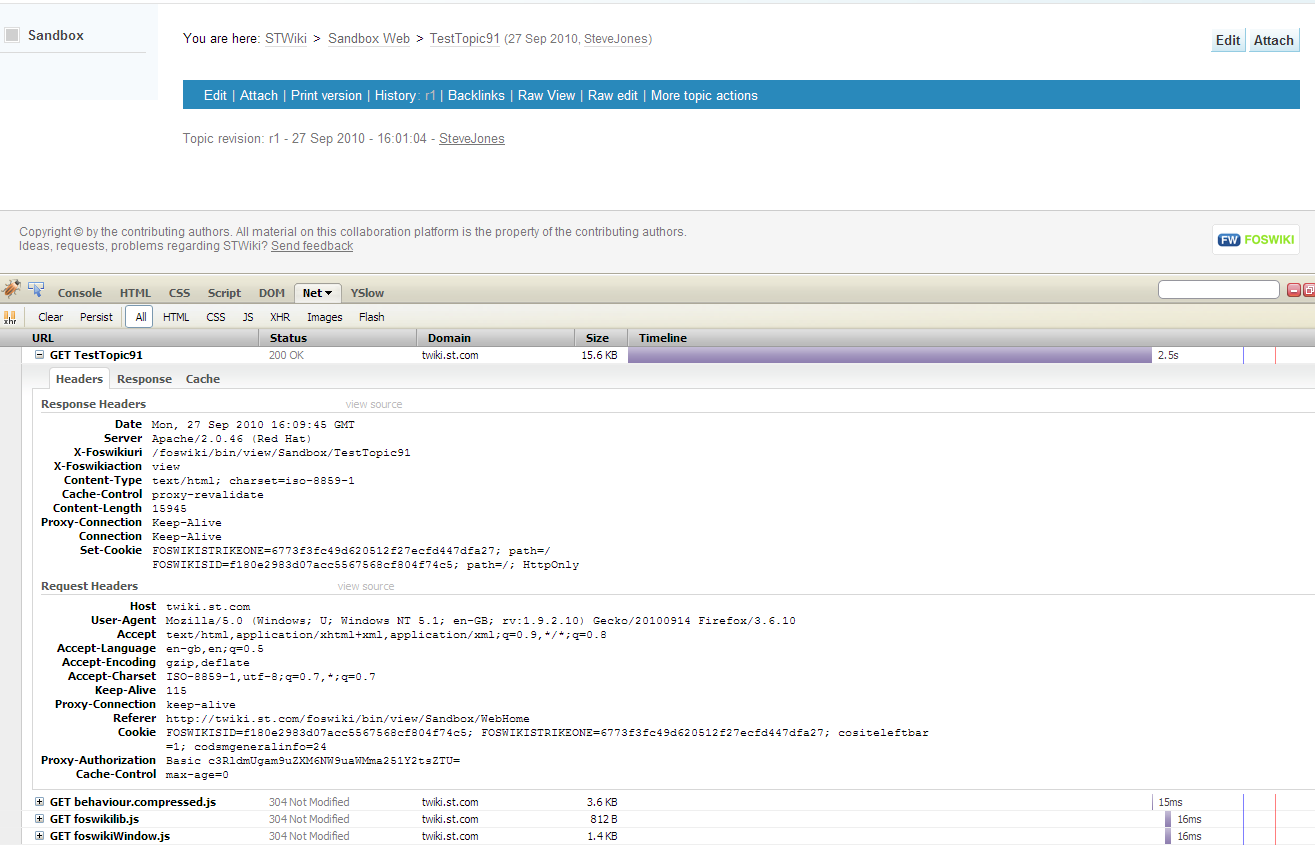
A few general checkpoints I can think of (running apache):
- bin/configure. Version of CGI module and other possible warning.
- System web/Installed Plugins, any errors down in the plugin listings
- apache (or web server) error logs
- foswiki data/warn*.txt log files
- mod_expires for browser caching. (is it enabled?)
- mod_fastcgi or mod_fcgi. I recently have had trouble with this on a new test server, in that case switch to mod_fcgid was best but you might try different.
- Issues with the compatability plugin? With
expertin configure you can see if extensions run in TWiki or Foswiki namespaces. Most or all should be foswiki and you could then disable the compatibility plugin - If you test empty pages, try disabling plugins, reload and see if it impacts performance.
You can also test the performance of the scripts outside of the influence of Apache by running them and timing them from the shell (cd to the bin directory). For example:
$ cd /var/www/foswiki/trunk/core/bin
$ time ./view Main/WebHome > /dev/null

real    0m0.558s
user    0m0.511s
sys     0m0.032s
If the times are short in the shell environment, then it points to something in the web env. If the above suggestions don't point to where the time is being spent and you want to bring out the heavy artillery, you can use something like CPAN:Devel::NYTProf to profile the code. This is pretty complex, so it needs some familiarity on Foswiki internal architecture. Install
Devel::NYTProf using CPAN, and then profile the script. The analysis is written as HTML to the nytprof directory using nytprofhtml
$ perl -T -d:NYTProf ./view Main/WebHome > /dev/null

$ nytprofhtml
Reading nytprof.out
Processing nytprof.out data
Writing sub reports to nytprof directory
 100% ...
Writing block reports to nytprof directory
 100% ...
Writing line reports to nytprof directory
 100% ...
This generally will show you exactly where time is being spent. -- GeorgeClark - 27 Sep 2010 There are a couple of non-core things that can also load up the rendering time - skin choice, and plugin choices. if you're getting 2.5 seconds to render a topic in the 'System' web without having added a skin or extra plugins into the mix, then there is something quite odd going on. another issue can happen with large webs - 50,000 topics etc - which we're working on atm - though that was worse on twiki, so I hope is not your problem. -- SvenDowideit - 28 Sep 2010 Hi I'm working with Steve on this. According to nytprof, I've noticed that Foswiki::Sandbox:: CORE:readline takes up a lot of time for longer pages. Another intensive sub seems to be Foswiki::Store::RcsFile:: getTopicNames Here's a summary of nytprof output for a Sandbox page which consists of hundreds of TABLE tags.
| Calls | P | F | Exclusive Time | Inclusive Time | Subroutine |
|---|---|---|---|---|---|
| 8 | 1 | 1 | 21.6s | 21.6s | Foswiki::Sandbox::::CORE:readline Foswiki::Sandbox:: CORE:readline (opcode) |
| 160 | 1 | 1 | 1.09s | 2.38s | Foswiki::Store::RcsFile::::getTopicNames Foswiki::Store::RcsFile:: getTopicNames |
| 37732 | 3 | 3 | 621ms | 821ms | Foswiki::::isValidTopicName Foswiki:: isValidTopicName |
| 1216 | 1 | 1 | 470ms | 470ms | Foswiki::Store::QueryAlgorithms::BruteForce::::CORE:openFoswiki::Store::QueryAlgorithms::BruteForce:: CORE:open (opcode) |
| 17391 | 1 | 1 | 419ms | 589ms | Foswiki::Store::::_singleKey Foswiki::Store:: _singleKey |
| 3723 | 2 | 1 | 336ms | 1.05s | Foswiki::Store::::_readKeyValues Foswiki::Store:: _readKeyValues |
| 219 | 1 | 1 | 298ms | 544ms | Foswiki::Prefs::Parser::::parseText Foswiki::Prefs::Parser:: parseText |
| 1483 | 1 | 1 | 283ms | 1.63s | Foswiki::Store::::extractMetaData Foswiki::Store:: extractMetaData |
| 157 | 1 | 1 | 247ms | 324ms | Foswiki::Search::::_searchTopics Foswiki::Search:: _searchTopics |
| 3691 | 8 | 5 | 240ms | 573ms | Foswiki::Query::Node::::evaluate Foswiki::Query::Node:: evaluate (recurses: max depth 2, inclusive time 239ms) |
| 82378 | 2 | 1 | 225ms | 225ms | Foswiki::Store::RcsFile::::CORE:match Foswiki::Store::RcsFile:: CORE:match (opcode) |
| 46285 | 37 | 1 | 174ms | 174ms | Foswiki::::CORE:match Foswiki:: CORE:match (opcode) |
| 3802 | 1 | 1 | 170ms | 393ms | Foswiki::Users::TopicUserMapping::::_cacheUser Foswiki::Users::TopicUserMapping:: _cacheUser |
| 43515 | 22 | 1 | 167ms | 167ms | Foswiki::Store::::CORE:subst Foswiki::Store:: CORE:subst (opcode) |
| 161 | 2 | 1 | 148ms | 148ms | Foswiki::Store::RcsFile::::CORE:readdir Foswiki::Store::RcsFile:: CORE:readdir (opcode) |
getTopicNames: the first (major) performance improvement I made when I migrated from T to Foswiki, was to eliminate use of the %WEBLIST macro in the WebLeftBar. It is quite slow and perhaps this is causing getTopicNames() calls (I don't really know).
As we only add new webs maybe once a month, I created a page that 'compiles' the list of webs statically into a dedicated topic so we now have %INCLUDE{"Main.WebNAV"}% instead of %<nopWEBLIST%.
Please re-do your timings by nop'ing out the WEBLIST in your WebLeftBar or try ?skin=plain in the URL (or -skin plain on the command line)
I'm also wondering about the web you're viewing the topic from. I'd like to know the response time of say, System.WebHome - both pattern and plain skins. If System is also slow, then I'd start wondering about your server's filesystem (fragmentation?) or disk i/o... For what it's worth, Foswiki 1.1 might perform better on large webs (especially where SEARCHs are involved), and it also has a PageCache feature.
-- PaulHarvey - 01 Oct 2010
Were you ever able to resolve your performance issues?
-- GeorgeClark - 27 Nov 2011
I created BestPracticeTip20 to document one way of removing WEBLIST usage
-- PaulHarvey - 01 Oct 2010
QuestionForm edit
| Subject | Installation of Foswiki |
| Extension | |
| Version | Foswiki 1.0.9 |
| Status | More info required |
| Related Topics |


| I | Attachment | Action | Size | Date | Who | Comment |
|---|---|---|---|---|---|---|
| |
firebug2.png | manage | 78 K | 27 Sep 2010 - 16:19 | SteveJones | firebug report from slow page request |
Edit | Attach | Print version | History: r9 < r8 < r7 < r6 | Backlinks | View wiki text | Edit wiki text | More topic actions
Topic revision: r9 - 27 Nov 2011, GeorgeClark
The copyright of the content on this website is held by the contributing authors, except where stated elsewhere. See Copyright Statement.  Legal Imprint Privacy Policy
Legal Imprint Privacy Policy